Check the starting point
- Plot ordered pairs on labelled axes.
- Interpret the gradient of a straight line.
Show the idea
Paired observations on a scatterplot
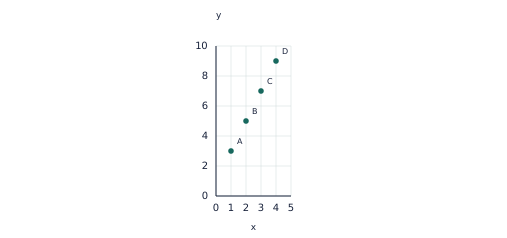
Each point is one paired observation. The values lie on y=2x+1, giving perfect positive linear association.
Work through an example
For predicted test score y=40+3 h, where h is study time in hours, interpret the slope and predict y at h=4.
- The fitted model is y=40+3h. The coefficient of h is the slope: one extra hour of study corresponds to 3 additional predicted score-points.
- Substitute h=4: y=40+3×4=40+12=52.
- This is the model prediction at four hours. The calculation does not establish that study time alone causes the score change.
Answer: 3 score-points per extra hour; y=52.
Teach in small steps
- Read the visual model together: Each point is one paired observation. The values lie on y=2x+1, giving perfect positive linear association.
- Model this example aloud: Plot (1,8), (2,6), (3,4), (4,2) and describe direction, form and strength. Guide: All four points lie exactly on y=10−2x: y falls by 2 for each extra unit of x. Result: Perfect negative linear association.
- Let your learner choose the steps for a new situation: A plant model h=4+2.2w was fitted for 2≤w≤8 weeks. Classify predictions at 5 and 12 weeks. Ask which part of the model or rule carries over before checking the worked solution.
- After a short break, ask for an independent response: The line y=24−3x models the observed pairs. Find the predicted value at x=6 and its x-intercept. Compare both the method and conclusion with the checkpoint answers, then revisit any misconception.
Ask and listen
- A fitted line is y=5+1.5x. Predict y at x=8 and interpret the gradient.
- A study pairs each person’s height with the next person’s arm span. Why is its scatterplot unsuitable for studying the relationship within people?
Adapt the practice
More support
Start with this prerequisite: Plot ordered pairs on labelled axes. Keep the visual visible. For the first guided problem, focus on this step: All four points lie exactly on y=10−2x: y falls by 2 for each extra unit of x.
More challenge
Try this application without looking at its answer: A scatterplot of car age and resale price slopes downward. Explain why this does not imply every older car is cheaper than every younger one. Then explain why the answer fits the stated domain or context.
Look for understanding
- Your learner can complete this checkpoint and explain the method: The line y=24−3x models the observed pairs. Find the predicted value at x=6 and its x-intercept.
- Your learner can justify or challenge this statement/question using the mathematical definitions: A study pairs each person’s height with the next person’s arm span. Why is its scatterplot unsuitable for studying the relationship within people?
Choose the next step
If either checkpoint needs prompting, repeat the worked model with changed values and revisit this caution: Association alone does not establish a causal relationship. When both are secure, use the linked Apply and extend resource and relevant VCE Key Knowledge/Key Skills activity.
Put the idea into practice
The matching topic collection includes learn-and-practise, application and checkpoint PDFs with worked answers. Download the free preview to see representative pages.
Explore this topic’s worksheets