Check the starting point
- Distinguish a label from a measurement.
- Divide a count by the total to form a proportion.
Show the idea
Categorical data needs separated bars
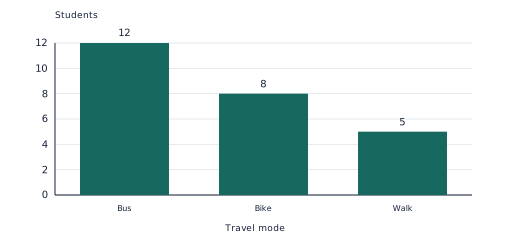
The three categories contain 25 students. Bus travel accounts for  =48%; the spaces between bars distinguish categories.
Work through an example
Classify travel mode and travel time, and choose a display for each.
- Travel mode records names such as bus, car and walk. The categories have no natural ranking, so this is a nominal categorical variable.
- Count the observations in each mode. A bar chart uses separate bars because the categories are distinct.
- Travel time is a measurement that can take non-integer values, even if the recorded times are rounded. It is a continuous numerical variable.
- Group travel times into numerical intervals and draw a histogram, with time on the horizontal axis and frequency on the vertical axis.
Answer: Mode: nominal categorical/bar chart. Time: continuous numerical/histogram.
Teach in small steps
- Read the visual model together: The three categories contain 25 students. Bus travel accounts for =48%; the spaces between bars distinguish categories.
- Model this example aloud: A survey records a jersey number, finishing position, laps completed and precise lap time. Classify each variable. Guide: A jersey number identifies a person. Position orders results. Laps are counted, while time is measured. Result: Nominal categorical; ordinal categorical; discrete numerical; continuous numerical.
- Let your learner choose the steps for a new situation: Shop A has 14 positive responses from 20 customers; shop B has 21 from 35. Compare their observed positive-response rates. Ask which part of the model or rule carries over before checking the worked solution.
- After a short break, ask for an independent response: A survey uses ratings poor, fair, good and excellent. Explain why coding them 1, 2, 3 and 4 does not make them measured distances. Compare both the method and conclusion with the checkpoint answers, then revisit any misconception.
Ask and listen
- A group has 6 train users, 9 bus users and 15 walkers. Draw a labelled bar chart and calculate the percentage who walk.
- There are 8 red, 12 blue and 20 green counters. Find the three relative frequencies and check their total.
Adapt the practice
More support
Start with this prerequisite: Distinguish a label from a measurement. Keep the visual visible. For the first guided problem, focus on this step: A jersey number identifies a person. Position orders results. Laps are counted, while time is measured.
More challenge
Try this application without looking at its answer: A teacher groups measured heights into 150–<160, 160–<170 and 170–<180 cm. Which display suits the frequencies, and why should adjacent bars touch? Then explain why the answer fits the stated domain or context.
Look for understanding
- Your learner can complete this checkpoint and explain the method: A survey uses ratings poor, fair, good and excellent. Explain why coding them 1, 2, 3 and 4 does not make them measured distances.
- Your learner can justify or challenge this statement/question using the mathematical definitions: There are 8 red, 12 blue and 20 green counters. Find the three relative frequencies and check their total.
Choose the next step
If either checkpoint needs prompting, repeat the worked model with changed values and revisit this caution: Numerical-looking labels, such as postcodes, can be categorical. When both are secure, use the linked Apply and extend resource and relevant VCE Key Knowledge/Key Skills activity.
Put the idea into practice
The matching topic collection includes learn-and-practise, application and checkpoint PDFs with worked answers. Download the free preview to see representative pages.
Explore this topic’s worksheets