Check the starting point
- Calculate within-group percentages.
- Distinguish categorical from numerical variables.
Show the idea
Direction does not establish a cause
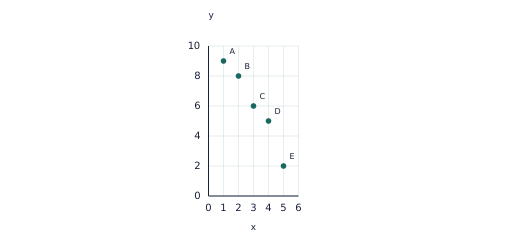
The paired values show a strong negative linear pattern. A scatterplot can suggest association; it cannot by itself establish causation.
Work through an example
Among 40 walkers, 30 support a proposal; among 60 drivers, 30 support it. Compare support proportions.
- The group sizes differ, so compare within-group proportions rather than the two equal supporter counts.
- Walkers:
 =0.75=75%. Drivers:
 =0.50=50%.
- The observed support rate is 75%-50%=25 percentage points higher among walkers. This describes association in the data.
Answer: 75% of walkers versus 50% of drivers.
Teach in small steps
- Read the visual model together: The paired values show a strong negative linear pattern. A scatterplot can suggest association; it cannot by itself establish causation.
- Model this example aloud: Group A has 24 supporters and 16 opponents; group B has 18 supporters and 42 opponents. Compare support rates. Guide: Use group totals 40 and 60. Counts alone would conceal the size of the difference in proportions. Result: 60% versus 30%.
- Let your learner choose the steps for a new situation: A school compares numerical reading times across three transport categories. Choose a suitable display and explain the variables. Ask which part of the model or rule carries over before checking the worked solution.
- After a short break, ask for an independent response: For x=−2,−1,0,1,2 and y=
 , explain why a small linear correlation need not mean no relationship. Compare both the method and conclusion with the checkpoint answers, then revisit any misconception.
Ask and listen
- Interpret r=−0.84, including what it does not establish.
- One group has 9 successes in 12 attempts, another has 45 in 75. Find and compare rates.
Adapt the practice
More support
Start with this prerequisite: Calculate within-group percentages. Keep the visual visible. For the first guided problem, focus on this step: Use group totals 40 and 60. Counts alone would conceal the size of the difference in proportions.
More challenge
Try this application without looking at its answer: A survey finds people who own more books have higher test scores. Give a plausible confounder and describe its role. Then explain why the answer fits the stated domain or context.
Look for understanding
- Your learner can complete this checkpoint and explain the method: For x=−2,−1,0,1,2 and y=, explain why a small linear correlation need not mean no relationship.
- Your learner can justify or challenge this statement/question using the mathematical definitions: One group has 9 successes in 12 attempts, another has 45 in 75. Find and compare rates.
Choose the next step
If either checkpoint needs prompting, repeat the worked model with changed values and revisit this caution: A correlation near zero rules out strong linear association, not every possible relationship. When both are secure, use the linked Apply and extend resource and relevant VCE Key Knowledge/Key Skills activity.
Put the idea into practice
The matching topic collection includes learn-and-practise, application and checkpoint PDFs with worked answers. Download the free preview to see representative pages.
Explore this topic’s worksheets