Check the starting point
- Calculate a mean and standard deviation.
- Interpret signed distance from a centre.
Show the idea
The shape behind standardised scores
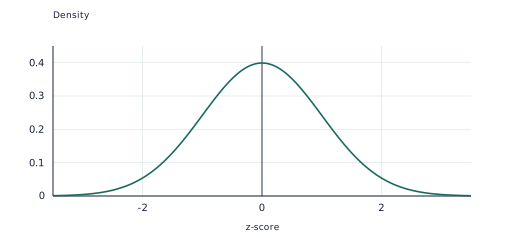
This is the standard normal density. The horizontal axis measures standard deviations from the mean; areas, not heights, represent probabilities.
Work through an example
A score 72 belongs to a distribution with mean 60 and SD 8. Find z.
- Use z=
 , with x=72, μ=60 and σ=8.
- The score is 72-60=12 points above the mean. Divide that difference by the standard deviation: z=
 =1.5.
- The positive sign means above the mean; the magnitude means 1.5 standard deviations.
Answer: 1.5.
Teach in small steps
- Read the visual model together: This is the standard normal density. The horizontal axis measures standard deviations from the mean; areas, not heights, represent probabilities.
- Model this example aloud: A score of 84 comes from a distribution with mean 72 and SD 6. Find its z-score. Guide: Subtract the mean and divide by the standard deviation:
 . Result: 2.
- Let your learner choose the steps for a new situation: A scored 65 on a test with mean 50 and SD 5; B scored 90 on a test with mean 75 and SD 10. Compare relative results. Ask which part of the model or rule carries over before checking the worked solution.
- After a short break, ask for an independent response: Find the mean and sample SD of 6, 9, 12. Compare both the method and conclusion with the checkpoint answers, then revisit any misconception.
Ask and listen
- A normal model has mean 50 and SD 4. Give approximate 68% and 95% intervals.
- Data are strongly skewed with a long high tail. Can the normal empirical rule be assumed merely because a mean and SD exist?
Adapt the practice
More support
Start with this prerequisite: Calculate a mean and standard deviation. Keep the visual visible. For the first guided problem, focus on this step: Subtract the mean and divide by the standard deviation: .
More challenge
Try this application without looking at its answer: Normal filling amounts have mean 500 mL and SD 10 mL. Estimate the proportion below 480 mL using the 95% rule. Then explain why the answer fits the stated domain or context.
Look for understanding
- Your learner can complete this checkpoint and explain the method: Find the mean and sample SD of 6, 9, 12.
- Your learner can justify or challenge this statement/question using the mathematical definitions: Data are strongly skewed with a long high tail. Can the normal empirical rule be assumed merely because a mean and SD exist?
Choose the next step
If either checkpoint needs prompting, repeat the worked model with changed values and revisit this caution: The 68–95–99.7 rule assumes an approximately normal distribution. When both are secure, use the linked Apply and extend resource and relevant VCE Key Knowledge/Key Skills activity.
Put the idea into practice
The matching topic collection includes learn-and-practise, application and checkpoint PDFs with worked answers. Download the free preview to see representative pages.
Explore this topic’s worksheets