 has mean p and SD
Check the starting point
- Calculate a sample proportion from count/total.
- Use square roots and interpret a margin around an estimate.
Show the idea
Sample size changes the standard error
| n | p | SD of sample proportion |
|---|---|---|
| 100 | 0.5 | 0.05 |
| 400 | 0.5 | 0.025 |
| 1600 | 0.5 | 0.0125 |
SD= . Multiplying n by four halves the standard error; it does not remove selection bias.
Work through an example
A random sample of 400 contains 240 successes. Find phat and its estimated standard error.
- The sample proportion is phat=
 =0.6.
- Use the estimated standard error SE=
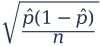 . Substitute phat=0.6 and n=400.
- The quantity under the square root is 0.6×
 =
 =0.0006.
- Therefore SE=
 ≈0.024495. This is a proportion scale, approximately 2.45 percentage points.
Answer: 0.6; ≈0.024495.
Teach in small steps
- Read the visual model together: SD=. Multiplying n by four halves the standard error; it does not remove selection bias.
- Model this example aloud: A random sample of 250 has 160 successes. Find phat and the estimated standard error. Guide: phat=
 . Estimated SE=
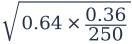 =
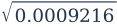 . Result: 0.64; approximately 0.03036.
- Let your learner choose the steps for a new situation: A random sample has phat=0.5 and n=1600. Give its approximate 95% interval using z=1.96. Ask which part of the model or rule carries over before checking the worked solution.
- After a short break, ask for an independent response: A valid method produces 200 nominal 95% intervals from independent repeated samples. Approximately how many should contain p? Is that count guaranteed? Compare both the method and conclusion with the checkpoint answers, then revisit any misconception.
Ask and listen
- For p=0.4 and n=600 independent trials, find the mean and variance of phat.
- An online poll with 50000 responses excludes people without internet access. Does a tiny calculated standard error prove representativeness?
Adapt the practice
More support
Start with this prerequisite: Calculate a sample proportion from count/total. Keep the visual visible. For the first guided problem, focus on this step: phat=. Estimated SE==.
More challenge
Try this application without looking at its answer: Using p≈0.5 and z=1.96, find the minimum whole n for a margin no larger than 0.04. Then explain why the answer fits the stated domain or context.
Look for understanding
- Your learner can complete this checkpoint and explain the method: A valid method produces 200 nominal 95% intervals from independent repeated samples. Approximately how many should contain p? Is that count guaranteed?
- Your learner can justify or challenge this statement/question using the mathematical definitions: An online poll with 50000 responses excludes people without internet access. Does a tiny calculated standard error prove representativeness?
Choose the next step
If either checkpoint needs prompting, repeat the worked model with changed values and revisit this caution: The sample proportion varies between samples; the population proportion is fixed. When both are secure, use the linked Apply and extend resource and relevant VCE Key Knowledge/Key Skills activity.
Put the idea into practice
The matching topic collection includes learn-and-practise, application and checkpoint PDFs with worked answers. Download the free preview to see representative pages.
Explore this topic’s worksheets