Check the starting point
- Calculate
 .
- Distinguish individuals from averages of independent samples.
Show the idea
Larger samples concentrate their means
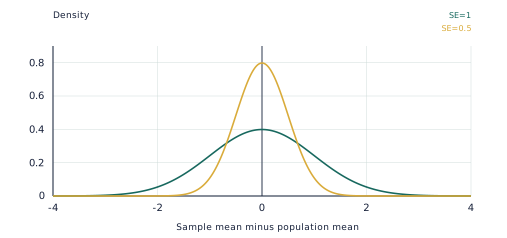
Two centred normal densities illustrate standard errors 1 and 0.5. The narrower distribution represents a sample size four times as large when population SD is fixed.
Work through an example
A population has mean 40 and SD 12. For independent random samples of size 36, find the mean and SD of the sample mean.
- For an independent random sample, E(Xbar)=μ=40; increasing sample size does not change the expected sample mean.
- The variance is
 =
 =
 =4.
- Take the square root to obtain SD(Xbar)=
 =2, equivalently
 =
 =2.
Answer: Mean 40; SD 2.
Teach in small steps
- Read the visual model together: Two centred normal densities illustrate standard errors 1 and 0.5. The narrower distribution represents a sample size four times as large when population SD is fixed.
- Model this example aloud: A population has mean 80 and SD 15. For samples of size 25, find mean and SD of Xbar. Guide: The sampling mean is μ and standard error is
 . Result: 80 and 3.
- Let your learner choose the steps for a new situation: For the preceding model, find the z-score of sample mean 44 and approximate P(36<Xbar<44) using the 95% rule. Ask which part of the model or rule carries over before checking the worked solution.
- After a short break, ask for an independent response: If sample size increases by a factor of 9, by what factor does standard error change? Compare both the method and conclusion with the checkpoint answers, then revisit any misconception.
Ask and listen
- The population is N(40,100). State the exact distribution of the mean of 25 independent observations.
- Why does the central limit theorem not repair a deliberately biased sample?
Adapt the practice
More support
Start with this prerequisite: Calculate . Keep the visual visible. For the first guided problem, focus on this step: The sampling mean is μ and standard error is .
More challenge
Try this application without looking at its answer: Population SD is 18. What smallest n makes the standard error no more than 2? Then explain why the answer fits the stated domain or context.
Look for understanding
- Your learner can complete this checkpoint and explain the method: If sample size increases by a factor of 9, by what factor does standard error change?
- Your learner can justify or challenge this statement/question using the mathematical definitions: Why does the central limit theorem not repair a deliberately biased sample?
Choose the next step
If either checkpoint needs prompting, repeat the worked model with changed values and revisit this caution: The standard error is , not  . When both are secure, use the linked Apply and extend resource and relevant VCE Key Knowledge/Key Skills activity.
Put the idea into practice
The matching topic collection includes learn-and-practise, application and checkpoint PDFs with worked answers. Download the free preview to see representative pages.
Explore this topic’s worksheets