Check the starting point
- Preserve paired measurements
- Interpret a straight-line slope in units
Show the idea
A scatterplot preserves pairs
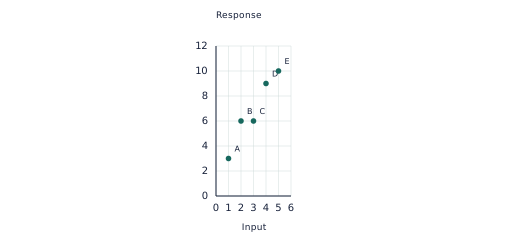
These invented pairs show a positive association with variation. Each point combines measurements from the same observation; the pattern alone is not causal evidence.
Work through an example
A scatterplot preserves pairs — explain the representation.
- These invented pairs show a positive association with variation. Each point combines measurements from the same observation; the pattern alone is not causal evidence.
- Connect the labels to the calculation or rule. A strong relationship does not by itself establish causation.
Answer: These invented pairs show a positive association with variation. Each point combines measurements from the same observation; the pattern alone is not causal evidence.
Teach in small steps
- Begin with a short oral check: ask your child to preserve paired measurements. Then check that they can interpret a straight-line slope in units. Revisit either skill before adding a new procedure.
- Explore “A scatterplot preserves pairs” together. These invented pairs show a positive association with variation. Each point combines measurements from the same observation; the pattern alone is not causal evidence. Ask your child to point to the quantities or features used at each step.
- Model the example: Points (1,4), (2,6), (3,8), (4,10) suggest what line? Pause before each step and invite a prediction. Output rises 2 per unit input. At x=0 the rule would give 2.
- Work together on the first new practice question: Describe the association in points (1,12), (2,9), (3,6), (4,3). Have your child attempt the remaining learn questions with less help, then move to apply. Use the checkpoint on a later attempt to see which ideas are retained.
Ask and listen
- Use y = 1.5x + 4 to predict y at x = 8.
- A school finds higher snack sales on hotter days. Can it claim snacks caused the heat?
Adapt the practice
More support
Return to “A scatterplot preserves pairs” and explain one label or step at a time. A strong relationship does not by itself establish causation. Let your child show a calculation, drawing or spoken explanation before requiring a polished written answer.
More challenge
Try this application after the core method is secure: A model was fitted using heights 120–170 cm. Classify a prediction at 150 cm and one at 190 cm. Then ask which assumption or input could be changed and what would need to be recalculated.
Look for understanding
- The learner can complete and explain this checkpoint task: Why must a time-series graph preserve chronological order?
- The learner can address the reasoning or error-checking question: A school finds higher snack sales on hotter days. Can it claim snacks caused the heat? Accept a correct alternative method, but ask for the mathematical reason.
Choose the next step
If both checks can be explained without prompting, continue to Two-way tables and association. If a method is still uncertain, repeat the visual example with fresh numbers before progressing.
Put the idea into practice
The matching topic collection includes learn-and-practise, application and checkpoint PDFs with worked answers. Download the free preview to see representative pages.
Explore this topic’s worksheets