Check the starting point
- Order data before taking medians
- Use the stated median-of-halves quartile convention
Show the idea
Five numbers describe position and spread
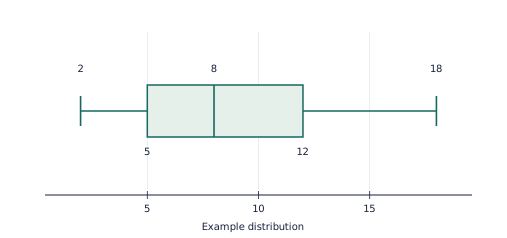
This ordinary min-to-max boxplot has summary (2,5,8,12,18). Its IQR is 7 and range is 16; it does not show individual values or sample size.
Work through an example
Five numbers describe position and spread — explain the representation.
- This ordinary min-to-max boxplot has summary (2,5,8,12,18). Its IQR is 7 and range is 16; it does not show individual values or sample size.
- Connect the labels to the calculation or rule. A boxplot does not show the number of observations unless that information is supplied.
Answer: This ordinary min-to-max boxplot has summary (2,5,8,12,18). Its IQR is 7 and range is 16; it does not show individual values or sample size.
Teach in small steps
- Begin with a short oral check: ask your child to order data before taking medians. Then check that they can use the stated median-of-halves quartile convention. Revisit either skill before adding a new procedure.
- Explore “Five numbers describe position and spread” together. This ordinary min-to-max boxplot has summary (2,5,8,12,18). Its IQR is 7 and range is 16; it does not show individual values or sample size. Ask your child to point to the quantities or features used at each step.
- Model the example: Find the five-number summary of 2,4,6,8,10,12,14,16. Pause before each step and invite a prediction. Median=
 =9. Q1=
 =5; Q3=
 =13.
- Work together on the first new practice question: Using medians of halves, find the five-number summary of 2, 6, 8, 10, 14, 16, 18, 22. Have your child attempt the remaining learn questions with less help, then move to apply. Use the checkpoint on a later attempt to see which ideas are retained.
Ask and listen
- Find range and IQR for summary 3, 8, 11, 17, 25.
- Does a wider box automatically mean more observations? Explain.
Adapt the practice
More support
Return to “Five numbers describe position and spread” and explain one label or step at a time. A boxplot does not show the number of observations unless that information is supplied. Let your child show a calculation, drawing or spoken explanation before requiring a polished written answer.
More challenge
Try this application after the core method is secure: Two groups have medians 18 and 21 and IQRs 4 and 4. Give a justified comparison. Then ask which assumption or input could be changed and what would need to be recalculated.
Look for understanding
- The learner can complete and explain this checkpoint task: For 1, 4, 5, 8, 10, 13, 16, omit the middle value when finding quartiles. Give Q1 and Q3.
- The learner can address the reasoning or error-checking question: Does a wider box automatically mean more observations? Explain. Accept a correct alternative method, but ask for the mathematical reason.
Choose the next step
If both checks can be explained without prompting, continue to Bivariate data and investigations. If a method is still uncertain, repeat the visual example with fresh numbers before progressing.
Put the idea into practice
The matching topic collection includes learn-and-practise, application and checkpoint PDFs with worked answers. Download the free preview to see representative pages.
Explore this topic’s worksheets