Check the starting point
- Count and record one response per person
- Read category labels and a consistent graph scale
Show the idea
A labelled graph preserves the data
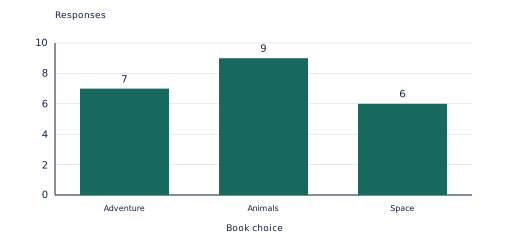
The counts are 7, 9 and 6, for 22 responses in total. Animals is most common; the zero baseline and equal scale allow fair comparison.
Work through an example
Read the bar graph. Find the combined count and the category or categories with the greatest value.
- Add the displayed values: 7 + 9 + 6 = 22.
- Compare heights against the labelled scale. The greatest value is 9.
- The counts are 7, 9 and 6, for 22 responses in total. Animals is most common; the zero baseline and equal scale allow fair comparison.
Answer: Total 22; greatest: Animals
Teach in small steps
- Check the starting skill together: Count and record one response per person. If this is uncertain, use the objects or drawings before beginning the worksheet.
- Ask each person for exactly one book choice and record it immediately in a tally table. Check the total equals the number of responses.
- Build the model graph from the table, starting the vertical scale at zero. Compare the largest category and the actual difference in counts.
- Let your child attempt this fresh example: Read the graph of book choices. How many responses are shown? Ask them to show the representation before checking the solution. Then use the application and checkpoint pages on later sessions.
Select the diagram to view it at full size.
Ask and listen
- Which book category is most common, and how many more responses does it have than Space?
- What part of the model helps you check your answer?
Adapt the practice
More support
Keep the labelled model beside the problem. Let your child describe each step aloud before writing the calculation.
More challenge
Collect a second small sample using the same question. Compare counts and explain why a different result does not automatically mean either survey is wrong.
Look for understanding
- Your child can read category labels and a consistent graph scale.
- Your child can explain this point and use it in a fresh problem: A display should preserve the data; changing scale or counting some responses twice can mislead.
Choose the next step
When your child can explain the model and complete fresh practice with little help, use the application problems. If the checkpoint reveals uncertainty, return to this starting skill: Count and record one response per person.
Put the idea into practice
The matching topic collection includes learn-and-practise, application and checkpoint PDFs with worked answers. Download the free preview to see representative pages.
Explore this topic’s worksheets