Check the starting point
- Read the value of a plotted point
- Use equal spacing for equal time intervals
Show the idea
A line joins ordered observations
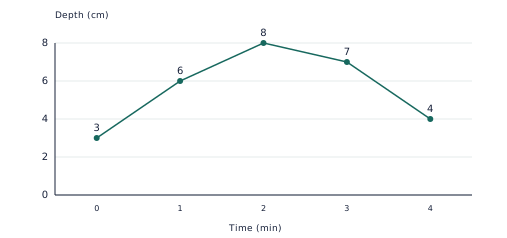
Depth rises from 3 cm to 8 cm by minute 2, then falls to 4 cm by minute 4. The labelled axes identify what changes and over what interval.
Work through an example
Find the highest recorded value and describe the change from the first observation to the last.
- The highest point has value 8 at 2.
- The final value minus the first is 4 − 3 = 1.
- Depth rises from 3 cm to 8 cm by minute 2, then falls to 4 cm by minute 4. The labelled axes identify what changes and over what interval.
Answer: Maximum 8 at 2; overall change 1.
Teach in small steps
- Check the starting skill together: Read the value of a plotted point. If this is uncertain, use the objects or drawings before beginning the worksheet.
- Build the graph from a small time-and-depth table. Label units before plotting and join observations in time order.
- Calculate changes between neighbouring readings. Distinguish a recorded point from an estimate along the joining segment.
- Let your child attempt this fresh example: Read the water depth at minute 2. Ask them to show the representation before checking the solution. Then use the application and checkpoint pages on later sessions.
Select the diagram to view it at full size.
Ask and listen
- Between which consecutive minutes does the depth fall most?
- What part of the model helps you check your answer?
Adapt the practice
More support
Use the model to explain each named feature before introducing a fresh question. Keep the scale, units and conditions visible.
More challenge
Ask your child to change one condition and decide whether the original conclusion still follows. Require a labelled example or counterexample.
Look for understanding
- Your child can use equal spacing for equal time intervals.
- Your child can explain this point and use it in a fresh problem: A line between measured points may support an estimate, but it is not evidence of an extra exact reading.
Choose the next step
When your child can explain the model and complete fresh practice with little help, use the application problems. If the checkpoint reveals uncertainty, return to this starting skill: Read the value of a plotted point.
Put the idea into practice
The matching topic collection includes learn-and-practise, application and checkpoint PDFs with worked answers. Download the free preview to see representative pages.
Explore this topic’s worksheets