Check the starting point
- Read a graph’s baseline, labels and units
- Separate observed evidence from a wider claim
Show the idea
Use a zero baseline for a bar comparison
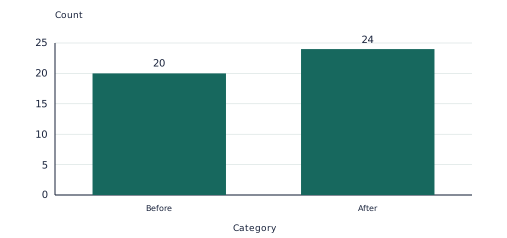
The actual counts are 20 and 24. The increase is 4, or one-fifth of 20; a full baseline keeps the bar lengths proportional.
Work through an example
The graph compares counts of 20 and 24. Describe the actual increase and explain why a zero baseline matters.
- Subtract the earlier count from the later count: 24 − 20 = 4.
- Compare with the original count:
 =
 , or 20%.
- With a zero baseline the bars have lengths proportional to the actual counts. A cropped baseline can exaggerate their ratio.
Answer: An increase of 4, or 20% of the original 20.
Teach in small steps
- Check the starting skill together: Read a graph’s baseline, labels and units. If this is uncertain, use the objects or drawings before beginning the worksheet.
- Draw bars from zero for 20 and 24, then sketch a cropped version starting at 18. Compare the apparent and numerical changes.
- Ask who supplied the data, how they were chosen and what population the conclusion actually describes.
- Let your child attempt this fresh example: A bar graph compares 20 and 24 using a baseline of 18. Give the actual increase. Ask them to show the representation before checking the solution. Then use the application and checkpoint pages on later sessions.
Ask and listen
- A poll of 12 football-club members says all enjoy football. Can it show all local residents enjoy football?
- What part of the model helps you check your answer?
Adapt the practice
More support
Use the model to explain each named feature before introducing a fresh question. Keep the scale, units and conditions visible.
More challenge
Ask your child to change one condition and decide whether the original conclusion still follows. Require a labelled example or counterexample.
Look for understanding
- Your child can separate observed evidence from a wider claim.
- Your child can explain this point and use it in a fresh problem: A larger sample does not automatically correct a biased collection method; a true number can still lack necessary context.
Choose the next step
When your child can explain the model and complete fresh practice with little help, use the application problems. If the checkpoint reveals uncertainty, return to this starting skill: Read a graph’s baseline, labels and units.
Put the idea into practice
The matching topic collection includes learn-and-practise, application and checkpoint PDFs with worked answers. Download the free preview to see representative pages.
Explore this topic’s worksheets