Check the starting point
- Plot ordered coordinate pairs
- Apply a rule to several inputs
Show the idea
A rule becomes a graph
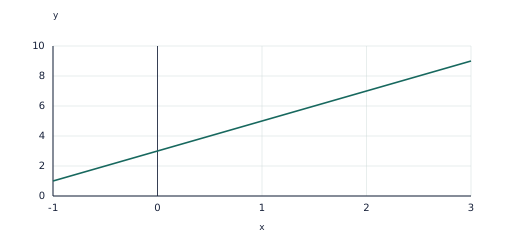
For y = 2x + 3, points (0,3), (1,5) and (2,7) lie on the same line. Equal x steps give equal y changes.
Work through an example
A rule becomes a graph — explain the representation.
- For y = 2x + 3, points (0,3), (1,5) and (2,7) lie on the same line. Equal x steps give equal y changes.
- Connect the labels to the calculation or rule. Coordinates are ordered; the axes and their units determine their meaning.
Answer: For y = 2x + 3, points (0,3), (1,5) and (2,7) lie on the same line. Equal x steps give equal y changes.
Teach in small steps
- Begin with a short oral check: ask your child to plot ordered coordinate pairs. Then check that they can apply a rule to several inputs. Revisit either skill before adding a new procedure.
- Explore “A rule becomes a graph” together. For y = 2x + 3, points (0,3), (1,5) and (2,7) lie on the same line. Equal x steps give equal y changes. Ask your child to point to the quantities or features used at each step.
- Model the example: Generate points for y = 2x + 1 using x = 0,1,2. Pause before each step and invite a prediction. Substitute the three inputs. Plot ordered pairs with x first.
- Work together on the first new practice question: Complete the table for y = 4x + 1 at x = 0, 2 and 4. Have your child attempt the remaining learn questions with less help, then move to apply. Use the checkpoint on a later attempt to see which ideas are retained.
Ask and listen
- A pattern has 7, 12, 17 and 22 tiles at stages 1 to 4. Find a rule for stage n.
- Values for x = 0, 1, 2, 3 give y = 2, 5, 10, 17. Is the relationship linear? Justify with differences.
Adapt the practice
More support
Return to “A rule becomes a graph” and explain one label or step at a time. Coordinates are ordered; the axes and their units determine their meaning. Let your child show a calculation, drawing or spoken explanation before requiring a polished written answer.
More challenge
Try this application after the core method is secure: A graph of distance from home rises, stays level, then falls to zero. Describe one possible journey. Then ask which assumption or input could be changed and what would need to be recalculated.
Look for understanding
- The learner can complete and explain this checkpoint task: Find the output at x = −2 for y = 3x + 7, and write the coordinate.
- The learner can address the reasoning or error-checking question: Values for x = 0, 1, 2, 3 give y = 2, 5, 10, 17. Is the relationship linear? Justify with differences. Accept a correct alternative method, but ask for the mathematical reason.
Choose the next step
If both checks can be explained without prompting, continue to Area of triangles and quadrilaterals. If a method is still uncertain, repeat the visual example with fresh numbers before progressing.
Put the idea into practice
The matching topic collection includes learn-and-practise, application and checkpoint PDFs with worked answers. Download the free preview to see representative pages.
Explore this topic’s worksheets