Check the starting point
- List equally likely outcomes
- Express a part of a total as a fraction
Show the idea
A spinner with equal sectors
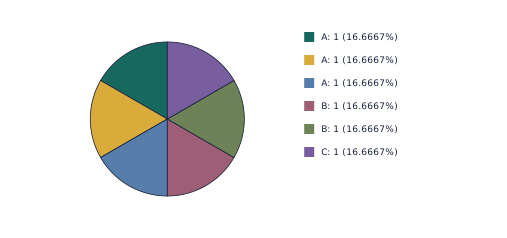
Six equal sectors are labelled A, A, A, B, B, C. A occupies half of the area; equal sector size supports the probability model.
Work through an example
A spinner with equal sectors — explain the representation.
- Six equal sectors are labelled A, A, A, B, B, C. A occupies half of the area; equal sector size supports the probability model.
- Connect the labels to the calculation or rule. Expected frequency is a prediction, not a promise for a finite experiment.
Answer: Six equal sectors are labelled A, A, A, B, B, C. A occupies half of the area; equal sector size supports the probability model.
Teach in small steps
- Begin with a short oral check: ask your child to list equally likely outcomes. Then check that they can express a part of a total as a fraction. Revisit either skill before adding a new procedure.
- Explore “A spinner with equal sectors” together. Six equal sectors are labelled A, A, A, B, B, C. A occupies half of the area; equal sector size supports the probability model. Ask your child to point to the quantities or features used at each step.
- Model the example: A fair six-sided die is rolled 120 times. Predict the count of multiples of 3. Pause before each step and invite a prediction. Favourable outcomes are 3 and 6: probability
 =
 . Expected count
 =40.
- Work together on the first new practice question: A fair die numbered 1–6 is rolled. Find the probability of a prime number. Have your child attempt the remaining learn questions with less help, then move to apply. Use the checkpoint on a later attempt to see which ideas are retained.
Ask and listen
- A bag contains 7 red, 5 blue and 8 green equally selectable counters. Find P(not green).
- A spinner has two red sectors and one blue sector, but the blue sector covers half the circle. Is P(blue) = ? Explain.
Adapt the practice
More support
Return to “A spinner with equal sectors” and explain one label or step at a time. Expected frequency is a prediction, not a promise for a finite experiment. Let your child show a calculation, drawing or spoken explanation before requiring a polished written answer.
More challenge
Try this application after the core method is secure: A trial produces 54 blue results in 150 draws with replacement. Find relative frequency and compare it with a theoretical probability of 0.4. Then ask which assumption or input could be changed and what would need to be recalculated.
Look for understanding
- The learner can complete and explain this checkpoint task: A fair die is rolled 90 times. Find the expected number of outcomes less than 3.
- The learner can address the reasoning or error-checking question: A spinner has two red sectors and one blue sector, but the blue sector covers half the circle. Is P(blue) = ? Explain. Accept a correct alternative method, but ask for the mathematical reason.
Choose the next step
If both checks can be explained without prompting, continue to the next ready topic in this year-level collection. If a method is still uncertain, repeat the visual example with fresh numbers before progressing.
Put the idea into practice
The matching topic collection includes learn-and-practise, application and checkpoint PDFs with worked answers. Download the free preview to see representative pages.
Explore this topic’s worksheets