Check the starting point
- Calculate centre and spread
- Recognise numerical intervals
Show the idea
A distribution has a shape
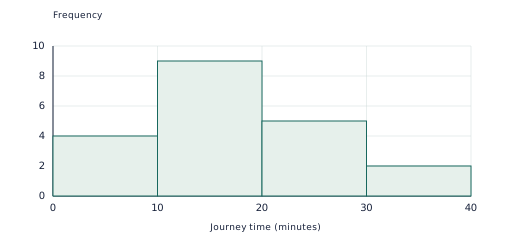
Invented journey times are grouped into equal ten-minute intervals. Frequencies total 20 and the longer tail is toward higher times.
Work through an example
A distribution has a shape — explain the representation.
- Invented journey times are grouped into equal ten-minute intervals. Frequencies total 20 and the longer tail is toward higher times.
- Connect the labels to the calculation or rule. Histogram bars represent numerical intervals, while bar charts represent categories.
Answer: Invented journey times are grouped into equal ten-minute intervals. Frequencies total 20 and the longer tail is toward higher times.
Teach in small steps
- Begin with a short oral check: ask your child to calculate centre and spread. Then check that they can recognise numerical intervals. Revisit either skill before adding a new procedure.
- Explore “A distribution has a shape” together. Invented journey times are grouped into equal ten-minute intervals. Frequencies total 20 and the longer tail is toward higher times. Ask your child to point to the quantities or features used at each step.
- Model the example: Compare A: 3,4,5,6,7 and B: 1,2,5,8,9. Pause before each step and invite a prediction. Both means and medians are 5. Ranges are 4 and 8.
- Work together on the first new practice question: Find the mean, median and range of 1, 4, 5, 6, 14. Have your child attempt the remaining learn questions with less help, then move to apply. Use the checkpoint on a later attempt to see which ideas are retained.
Ask and listen
- Compare the ranges of A: 6,7,8,9,10 and B: 2,5,8,11,14. Both have median 8.
- A learner says a histogram with two tall bars is always bimodal. What else must be considered?
Adapt the practice
More support
Return to “A distribution has a shape” and explain one label or step at a time. Histogram bars represent numerical intervals, while bar charts represent categories. Let your child show a calculation, drawing or spoken explanation before requiring a polished written answer.
More challenge
Try this application after the core method is secure: Two histograms have different group sizes. How could relative frequencies help comparison? Then ask which assumption or input could be changed and what would need to be recalculated.
Look for understanding
- The learner can complete and explain this checkpoint task: What is the median of 2, 5, 7, 9, 10, 15?
- The learner can address the reasoning or error-checking question: A learner says a histogram with two tall bars is always bimodal. What else must be considered? Accept a correct alternative method, but ask for the mathematical reason.
Choose the next step
If both checks can be explained without prompting, continue to Evidence in statistical investigations. If a method is still uncertain, repeat the visual example with fresh numbers before progressing.
Put the idea into practice
The matching topic collection includes learn-and-practise, application and checkpoint PDFs with worked answers. Download the free preview to see representative pages.
Explore this topic’s worksheets