Check the starting point
- Distinguish random selection from volunteering
- Compare rates with their denominators
Show the idea
Show a zero baseline for bar lengths
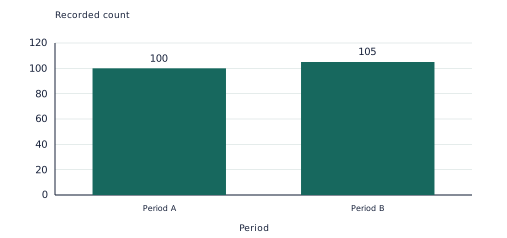
The invented values 100 and 105 differ by 5%. Showing their full bar lengths avoids the exaggeration caused by a baseline near 100.
Work through an example
Show a zero baseline for bar lengths — explain the representation.
- The invented values 100 and 105 differ by 5%. Showing their full bar lengths avoids the exaggeration caused by a baseline near 100.
- Connect the labels to the calculation or rule. A large sample does not automatically make a survey representative.
Answer: The invented values 100 and 105 differ by 5%. Showing their full bar lengths avoids the exaggeration caused by a baseline near 100.
Teach in small steps
- Begin with a short oral check: ask your child to distinguish random selection from volunteering. Then check that they can compare rates with their denominators. Revisit either skill before adding a new procedure.
- Explore “Show a zero baseline for bar lengths” together. The invented values 100 and 105 differ by 5%. Showing their full bar lengths avoids the exaggeration caused by a baseline near 100. Ask your child to point to the quantities or features used at each step.
- Model the example: A study of all students surveys only volunteers from the chess club. Identify the limitation. Pause before each step and invite a prediction. The sample excludes many students and is self-selected. Club membership may relate to the measured variable.
- Work together on the first new practice question: A survey asks “Should our brilliant new sports centre receive more funding?” Remove the leading wording. Have your child attempt the remaining learn questions with less help, then move to apply. Use the checkpoint on a later attempt to see which ideas are retained.
Ask and listen
- A random survey contacts 200 people but only 80 reply. Find the response rate.
- Why is “weekly screen time” a clearer survey variable than “usual screen time”?
Adapt the practice
More support
Return to “Show a zero baseline for bar lengths” and explain one label or step at a time. A large sample does not automatically make a survey representative. Let your child show a calculation, drawing or spoken explanation before requiring a polished written answer.
More challenge
Try this application after the core method is secure: Two samples have data A: 12, 14, 16, 18 and B: 8, 14, 18, 24. Compare means and explain why a difference alone does not prove bias. Then ask which assumption or input could be changed and what would need to be recalculated.
Look for understanding
- The learner can complete and explain this checkpoint task: A graph reports an increase from 40 to 50. Find the percentage increase and the absolute increase.
- The learner can address the reasoning or error-checking question: Why is “weekly screen time” a clearer survey variable than “usual screen time”? Accept a correct alternative method, but ask for the mathematical reason.
Choose the next step
If both checks can be explained without prompting, continue to Comparing data distributions. If a method is still uncertain, repeat the visual example with fresh numbers before progressing.
Put the idea into practice
The matching topic collection includes learn-and-practise, application and checkpoint PDFs with worked answers. Download the free preview to see representative pages.
Explore this topic’s worksheets